 Discuss your project ↗︎
PRODUCT 05 · AUTOMATIC CHART GENERATION
HYDROCHARTSurvey data.Chart ready.
An AutoCAD extension that automates North-Up alignment sheet production for hydrographic and geophysical survey data—helping teams save time, control cost and deliver consistent charts to client specifications.
Explore HydroChart ↓︎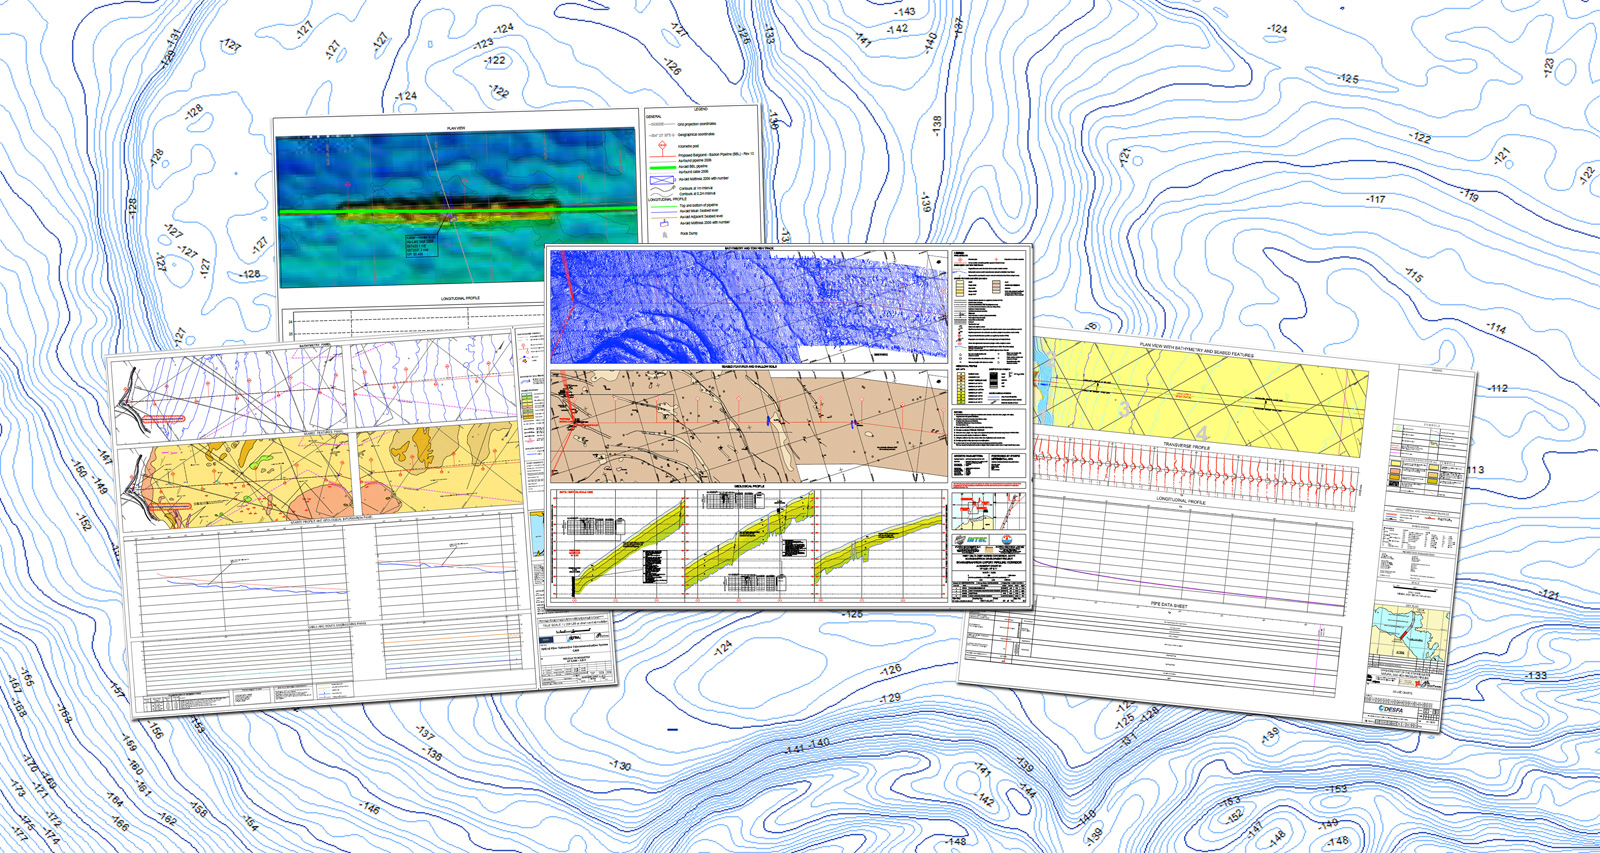
/ 01 — BUILT INTO AUTOCAD
Complex charting,
made repeatable.
HydroChart supports MariSoft Data Processing, Charting and Reporting Services by automating the creation and population of North-Up alignment sheets. It turns complex survey information into structured, repeatable deliverables while maintaining the presentation standards defined for each project.
/ 02 — AUTOMATION THAT ADDS VALUE
From panel creation to interpreted data.
HydroChart reduces repetitive production work and gives charting teams a controlled way to build complex survey sheets, calculations and profiles.
Consistent standards
Keep chart presentation consistent across the complete deliverable set.
Automated creation
Automate chart creation and the addition of survey data within the drawing workflow.
Route + area panels
Create panels based on survey routes or defined areas.
Grid + geographic lattice
Build the grid and geographical lattice required for the selected chart layout.
KP calculations
Calculate and present Kilometre Post references along route-based survey work.
Profiles + events
Create longitudinal profiles, cross-profiles and pipeline events as part of the chart set.
Sub-bottom interpretation
Add digitally interpreted Sub-Bottom Profile data to the finished survey deliverable.
Time + cost control
Simplify complex chart creation and reduce the manual effort required for production.
Specification led
Configure North-Up alignment sheets to comply with the client’s presentation requirements.
/ 03 — DATA INTO CONTEXT
Turn survey geometry into a usable record.
HydroChart brings routes, areas, geographic references, interpreted profiles and pipeline events together in the chart environment—ready for disciplined review and reporting.
/ 04 — CHART TYPES
One production system.
Multiple survey scopes.
Use the same controlled charting workflow across site work, route surveys, engineering deliverables and strip-chart presentation.
/ 05 — OUTPUTS
Detailed charts.
Consistent delivery.
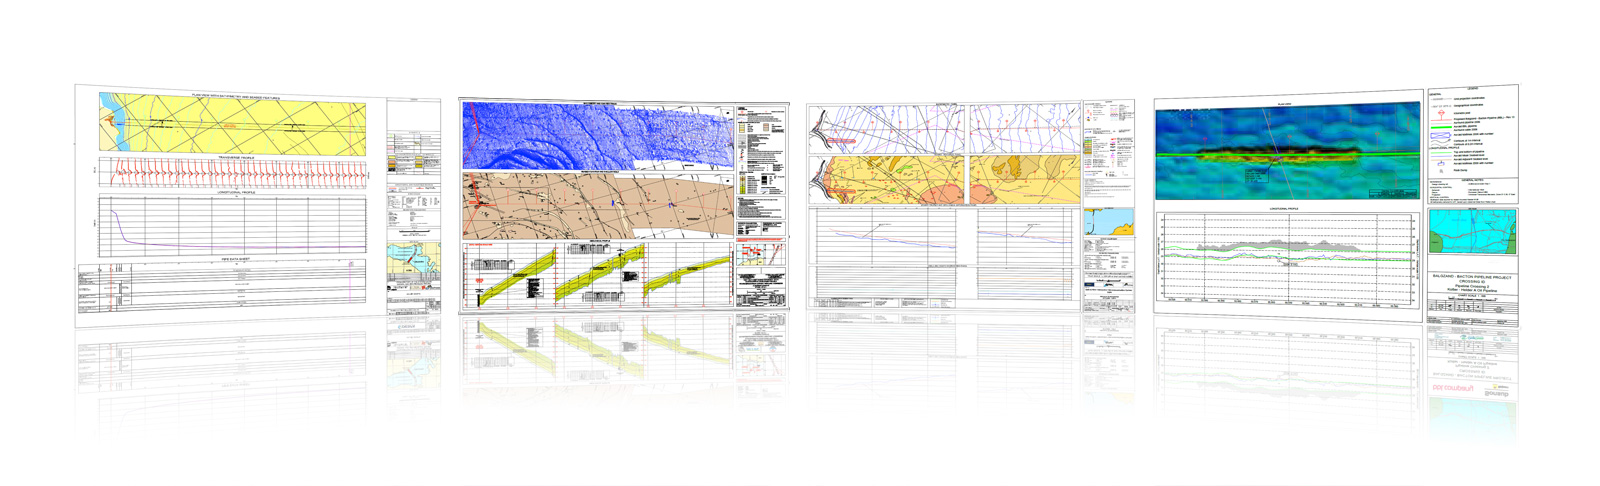
North-Up alignment sheets, survey panels, profiles and supporting chart information.
/ 06 — TALK TO MARISOFT
Bring automation to your next charting scope.
Tell us about your survey data, drawing standards and required deliverables. We can discuss how HydroChart fits your data processing, charting and reporting workflow.
Start a conversation ↗︎info@marisoftoil.com